This is the first of a series of how-to tutorials, primarily centered around cool things that you can
do with Python, particularly the Numpy, Scipy, and matplotlib libraries. Matplotlib (mpl) is a robust and
versatile plotting package, with which we can display data in a wide variety of graphical styles. mpl charts are generally initialized
by executing Python scripts, or within a Python interpreter session (ie, iPython). However, at times it may be useful or even necessary to display a chart
with which the user can interact dynamically via a point-and-click interface, namely, a GUI. There are several GUI frameworks out there with Python bindings,
but PyQt4, a set of Python bindings for the native-C++ Qt framework, is the one with which I've worked the most, and it's suited my purposes just fine. For a basic working knowledge of the PyQt4 syntax, I recommend
the Zetcode tutorial or the resources at TutorialsPoint; Summerfield provides the best in-depth covereage if/when you want to get serious. This tutorial presupposes at least a cursory familiarity with PyQt.
Initializing the PyQt4 App
Once you have a working install of PyQt4 (
sudo apt-get install python-qt4 on Debian/Ubuntu, google for further details), every viable PyQt4 application is going to need some fairly standard boilerplate code.
The function of this code will be to import PyQt, define a subclass of the PyQt QMainWindow class (this is used as the container for pretty much any nontrivial PyQt application, in which you want to include multiple
widgets),
and then define a
main() method, which actually generates the window. We can do this with the following code:
from PyQt4 import QtCore, QtGui, Qt
import sys
class ApplicationWindow(QtGui.QMainWindow):
    def __init__(self):
        QtGui.QMainWindow.__init__(self)
        self.initUI()
    def initUI(self):
        self.main_frame = QtGui.QWidget()
        self.setCentralWidget(self.main_frame)
def main():
    qApp = QtGui.QApplication(sys.argv)
    a=ApplicationWindow()
    a.show()
    sys.exit(qApp.exec_())
if __name__ == '__main__':
    main()
We'll save this as
basic.py, after which we can run it from a terminal window using
python basic.py, or within an Python interpreter session via
!python basic.py . The result should be a blank window, with a titlebar displaying the name of the file.
Importing the matplotlib Figure class
Now for the fun part. In matplotlib (referred to from here on out as mpl for brevity), all objects are drawn onto a basic area called a FigureCanvas. However, there are different instantiations of the FigureCanvas, depending on which GUI framework one wishes to use to display a given mpl creation.
Normally, this is not something the user has to worry about, since the pyplot library will automate all of this. However, if we wish to embed a mpl chart in something besides mpl, we need to import the proper library that allows mpl to create an image that will play nice with the GUI framework in which we are embedding it.
Therefore, we will redefine the standard FigureCanvas class with the following statement:
from matplotlib.backends.backend_qt4agg import FigureCanvasQTAgg as FigureCanvas
In addition, we need the Figure class, because this is the primary object that mpl can "paint" onto its backends.
from matplotlib.figure import Figure
Now, we can define a new subclass of the PyQt QMainWindow, in which we use our imported classes. We will need to use the QLayout() containers to tell PyQt how to position the graph we are inserting into the QMainWindow. The code for this is shown below:
from PyQt4 import QtCore, QtGui, Qt
import sys
from matplotlib.figure import Figure
from matplotlib.backends.backend_qt4agg import FigureCanvasQTAgg as FigureCanvas
import numpy as np
class ApplicationWindow(QtGui.QMainWindow):
    def __init__(self):
        QtGui.QMainWindow.__init__(self)
        self.initUI()
    def initUI(self):
        self.main_frame = QtGui.QWidget()
        self.setWindowTitle("Matplotlib Figure in a Qt4 Window")
        self.fig=Figure()
        self.axes = self.fig.add_subplot(111)
        self.x = np.arange(0.0, 1.0, 0.01)
        self.y = np.cos(2*np.pi*self.x + 5) + 2
        self.axes.plot(self.x, self.y)
        self.canvas=FigureCanvas(self.fig)
        self.canvas.setParent(self.main_frame)
        self.canvas.setFocusPolicy(QtCore.Qt.StrongFocus)
        self.canvas.setFocus()
        vbox = QtGui.QVBoxLayout()
        vbox.addWidget(self.canvas)
        self.main_frame.setLayout(vbox)
        self.setCentralWidget(self.main_frame)
def main():
    qApp = QtGui.QApplication(sys.argv)
    a=ApplicationWindow()
    a.show()
    sys.exit(qApp.exec_())
if __name__ == '__main__':
    main()
This should result in a beautiful graph of a sine wave, as seen below.
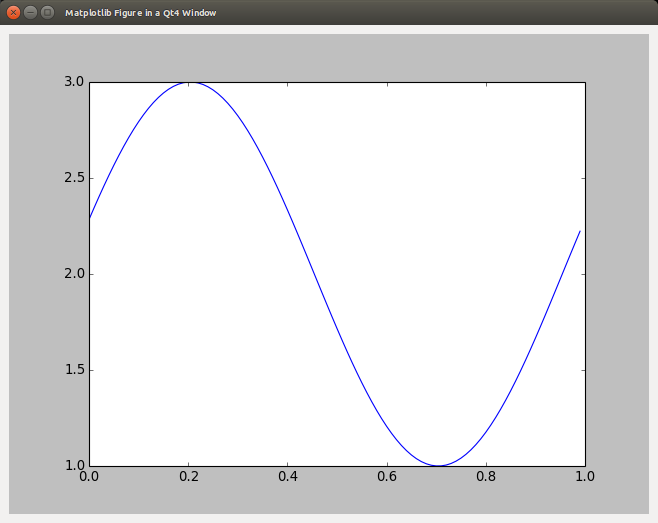
However, if you are familiar with mpl, you are probably not yet satisfied, and perhaps are even shaking your fists in anger at the false promises which led you to this page. That is because the graph at which you are staring
has none of the convenient interactive mpl keyboard functionality which you have come to know and love. Never fear, for our next concern will be
Adding the Navigation Toolbar to the GUI
We can import the mpl Navigation Toolbar into PyQt4 in a fashion almost completely analogous to how we imported the FigureCanvas:
from matplotlib.backends.backend_qt4agg import NavigationToolbar2QTAgg as NavigationToolbar
However, we will need to specify how this toolbar (which PyQt treats as a totally distinct
widget), is to be arranged in our QMainWindow,
and we will also need to tell PyQt explicitly to use the mpl event-handling functions to respond to user input whenever the self.canvas widget has keyboard focus.
This will require us to directly import the key_press_handler function from mpl.backend_bases:
from matplotlib.backend_bases import key_press_handler
We then initialize the NavigationToolbar within the initUI() function as:
self.ntb = NavigationToolbar(self.canvas, self.main_frame)
After declaring it, we will use the QtGui QLayout.addWidget() method to insert it into the main_frame main widget. If we want the toolbar beneath the canvas, we should call this method on the toolbar
immediately after calling the same method on the canvas. If we want the toolbar above the canvas, then we should reverse the order of these function calls.
vbox = QtGui.QVBoxLayout()
vbox.addWidget(self.canvas)
vbox.addWidget(self.ntb)
self.main_frame.setLayout(vbox)
self.setCentralWidget(self.main_frame)
Finally, we will reinstantiate the key_press_event function of the canvas widget, by connecting it to an event-handling function that we define ourselves. We add the connection statement any time after defining self.canvas,
before the layout block in the initUI():
self.canvas.mpl_connect('key_press_event', self.on_key_press)
and then proceed to define on_key_press() as a distinct method of our ApplicationWindow class, using it to call the imported mpl key_press_handler function, and print any pressed keys to the console for informational purposes:
def on_key_press(self, event):
	print('you pressed', event.key)
	key_press_handler(event, self.canvas, self.ntb)
The final code for this example is given below:
from PyQt4 import QtCore, QtGui, Qt
import sys
import numpy as np
from matplotlib.figure import Figure
from matplotlib.backends.backend_qt4agg import FigureCanvasQTAgg as FigureCanvas
from matplotlib.backends.backend_qt4agg import NavigationToolbar2QTAgg as NavigationToolbar
from matplotlib.backend_bases import key_press_handler

class ApplicationWindow(QtGui.QMainWindow):
    def __init__(self):
        QtGui.QMainWindow.__init__(self)
        self.initUI()
    def initUI(self):
        self.main_frame = QtGui.QWidget()
        self.setWindowTitle("Matplotlib Figure in a Qt4 Window With NavigationToolbar")
        self.fig=Figure()
        self.axes = self.fig.add_subplot(111)
        self.x = np.arange(0.0, 1.0, 0.01)
        self.y = np.cos(2*np.pi*self.x + 5) + 2
        self.axes.plot(self.x, self.y)
        self.canvas=FigureCanvas(self.fig)
        self.canvas.setParent(self.main_frame)
        self.canvas.setFocusPolicy(QtCore.Qt.StrongFocus)
        self.canvas.setFocus()
        self.ntb = NavigationToolbar(self.canvas, self.main_frame)
        self.canvas.mpl_connect('key_press_event', self.on_key_press)

        vbox = QtGui.QVBoxLayout()
        vbox.addWidget(self.canvas)  # the matplotlib canvas
        vbox.addWidget(self.ntb)
        self.main_frame.setLayout(vbox)
        self.setCentralWidget(self.main_frame)

    def on_key_press(self, event):
        print('you pressed', event.key)
        key_press_handler(event, self.canvas, self.ntb)


def main():

    qApp = QtGui.QApplication(sys.argv)
    a=ApplicationWindow()
    a.show()
    sys.exit(qApp.exec_())
if __name__ == '__main__':
    main()
Running this code, you will see the mpl Navigation Toolbar beneath the canvas. You will now be able to use some familiar keyboard shortcuts, like 'g' for toggling gridlines and
'l' for toggling between linear and logarithmic axes.
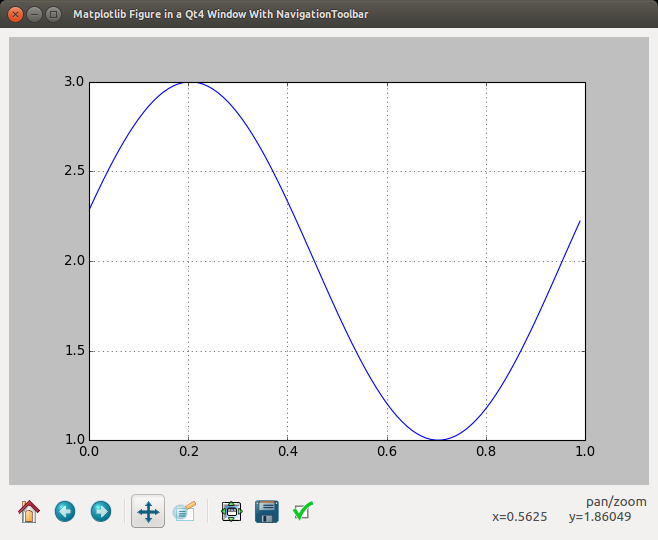
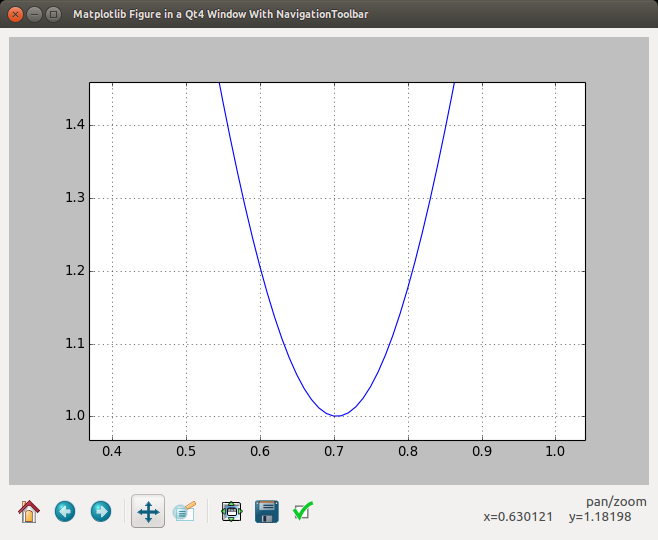
By clicking the icon with 4 arrows at right angles, you can pan and zoom around the graph using left and right mouse buttons, respectively.
A full list of shortcuts and navigation capabilities can be found
on the official matplotlib documentation site.
In effect, we have now reproduced a fully functional interactive matplotlib window. While this is indubitably cool, it also might be perceived as a somewhat redundant, or pointless exercise. That is because we have not yet begun to tap into the creative freedom that PyQt permits us to unleash. Regardless, you can download all code for this tutorial from the
mplEmbed repo at Github, in the basicEmbeds subdirectory.
A modest sample of possible extensions to this framework will be illustrated in the
next tutorial, where we will create an interactive graphing calculator.
Back to Code Page
Go Home